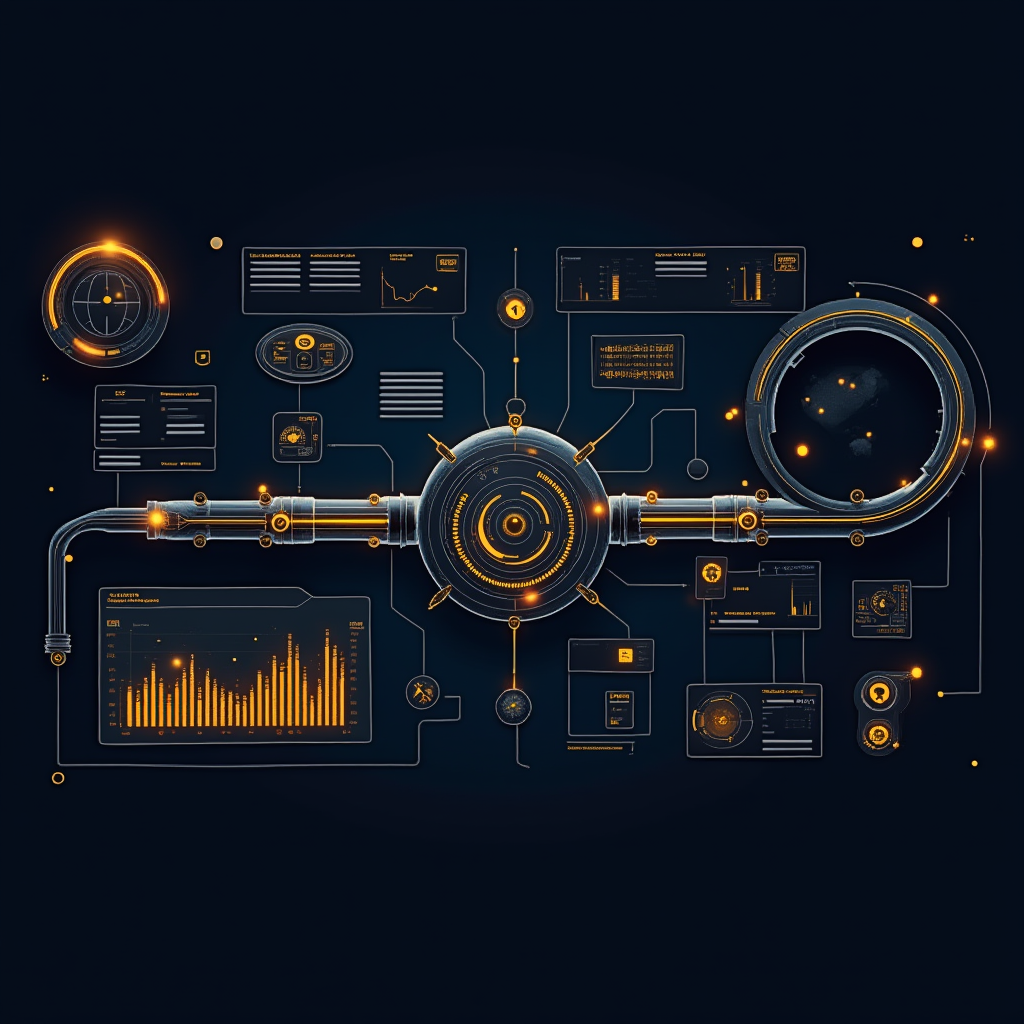
#— LLM— observability— basics:— traces,— prompts,— evals— and— feedback— loops
Most— LLM— observability— tools— look— great— in— a— demo— and— useless— in— production.— They— show— you— dashboards— with— colourful— latency— charts— and— token— counters,— but— they— do— not— answer— the— question— that— matters:— is— the— quality— of— your— AI— feature— improving— or— degrading?
Observability— for— LLM— applications— is— not— just— monitoring— —— it— is— a— feedback— loop.— You— trace— what— happened,— you— evaluate— whether— it— was— good,— you— review— samples,— and— you— use— the— results— to— improve— the— prompt,— the— retrieval,— or— the— model.
A-- latency-- chart-- without-- an-- accuracy-- chart-- is-- a-- vanity-- metric.-- Faster-- wrong-- answers-- are-- not-- an-- improvement.-- If-- your-- observability-- dashboard-- only-- tracks-- performance-- (latency,-- tokens,-- error-- rates)-- and-- not-- quality-- (evaluation-- scores,-- feedback-- trends,-- accuracy-- drift),-- you-- are-- monitoring-- a-- black-- box-- and-- calling-- it-- observability.
##— TL;DR
Build— LLM— observability— around— four— data— layers,— each— answering— a— specific— question:
1.— Traces— —— what— happened?— (latency,— token— usage,— model,— provider,— error— codes) 2.— Prompts— —— what— was— the— input?— (full— prompt— +— response— logged— for— sampling) 3.— Evals— —— was— it— good?— (accuracy,— safety,— relevance— scores— against— ground— truth) 4.— Feedback— —— did— the— user— think— it— was— good?— (thumbs— up/down,— corrections,— downstream— actions)
Most— teams— build— traces— and— skip— evals— and— feedback.— That— gives— you— a— performance— dashboard— without— a— quality— dashboard.— You— will— know— your— system— is— fast— but— not— whether— it— is— working.
##— What— the— benchmarks— miss
Tracing— is— not— observability.— Logging— every— API— call— with— latency— and— token— count— is— monitoring.— Observability— means— you— can— answer— a— question— you— did— not— think— to— ask— —— like— “what— does— the— pattern— of— long-tail— latency— look— like— for— queries— about— topic— X?”— or— “are— users— who— rate— the— output— poorly— seeing— systematically— different— response— lengths?”
Sampling— strategy— matters— more— than— volume.— Logging— every— single— prompt-and-response— pair— is— expensive,— creates— privacy— risks,— and— produces— a— dataset— too— large— to— review— manually.— Log— everything— for— aggregate— metrics,— sample— a— representative— subset— for— quality— review.— The— right— sample— rate— depends— on— your— traffic— volume— and— review— capacity.
LLM-as-judge— is— useful— but— not— sufficient.— Using— a— model— to— evaluate— outputs— scales— well,— but— evaluator— models— have— their— own— biases,— blind— spots,— and— failure— modes.— Use— LLM-assisted— evaluation— for— coverage,— but— validate— with— human— review— on— a— representative— sample.
Feedback— is— noisy— but— essential.— Users— rarely— provide— feedback.— When— they— do,— the— feedback— is— disproportionately— about— edge— cases— and— emotional— reactions.— Do— not— build— your— quality— metrics— solely— on— user— feedback,— but— do— not— ignore— it— either.— Cross-reference— feedback— with— trace— data— to— find— patterns.
The-- most-- expensive-- observability-- setup-- is-- the-- one-- that-- generates-- so-- much-- data-- you-- never-- look-- at-- it.-- Sample-- aggressively-- —-- 1–5%-- of-- requests-- is-- usually-- plenty-- for-- quality-- review-- —-- and-- design-- your-- dashboards-- around-- the-- three-- decisions-- you-- actually-- need-- to-- make.-- If-- a-- chart-- does-- not-- change-- what-- you-- do,-- remove-- it.
##— What— to— trace
| — Trace— field— | — Why— it— matters— | — Aggregate— metric— |
|---|---|---|
| — Request— timestamp— | — Time-of— a— day— patterns— | — Peak— load,— latency— by— hour— |
| — Model/provider— | — Cost— and— quality— by— provider— | — Cost— per— request,— accuracy— by— model— |
| — Input— length— (tokens)— | — Context— window— pressure— | — Overflow— rate,— cost— per— query— |
| — Output— length— (tokens)— | — Response— verbosity— | — Output/input— ratio— trend— |
| — Latency— —— first— token— | — User-perceived— speed— | — P50,— P95,— P99— first-token— time— |
| — Latency— —— total— | — End-to-end— user— experience— | — P50,— P95,— P99— total— time— |
| — Error— code— | — System— health— | — Error— rate— by— provider,— error— rate— by— model— |
| — Retry— count— | — Reliability— | — Retry— rate,— cascade— fallback— rate— |
| — User— ID— (hashed)— | — Per-user— patterns— | — Quality— score— per— user,— feedback— rate— per— user— |
##— Where— teams— misuse— observability
Dashboards— without— decisions.— A— dashboard— with— 40— charts— that— no— one— looks— at— is— not— observability— —— it— is— decoration.— For— each— chart,— answer:— what— will— we— do— differently— if— this— number— changes?— If— the— answer— is— “nothing”,— remove— the— chart.
Privacy-first— without— a— plan.— PII— logging,— prompt— data,— and— user— feedback— all— create— privacy— obligations.— Do— not— log— raw— user— inputs— without— a— retention— policy,— access— controls,— and— a— deletion— mechanism.— Observed-by-default— can— become— a— compliance— liability.
Observability— during— incidents— only.— If— you— only— look— at— your— observability— data— when— something— breaks,— you— will— miss— gradual— degradation.— Set— up— automated— alerting— on— quality— metrics— (evaluation— score— below— threshold— for— 15— minutes)— not— just— performance— metrics— (latency— above— threshold).
##— Practical— implementation
###— Stage— 1— —— Trace— everything— with— sampling
Instrument— every— LLM— call— with— request/response— timing,— model,— token— count,— and— error— code.— Use— OpenTelemetry— for— vendor-agnostic— tracing.— Log— full— prompt-and-response— pairs— at— 1–5%— sampling— for— quality— review.— Store— aggregate— metrics— in— your— existing— monitoring— stack.
###— Stage— 2— —— Add— evaluation
Integrate— evaluation— at— the— trace— level:— for— a— subset— of— requests,— run— an— evaluator— model— or— rule-based— check— and— attach— the— score— to— the— trace.— Track— accuracy,— safety,— and— relevance— scores— as— time-series— metrics— alongside— latency— and— cost.
###— Stage— 3— —— Close— the— feedback— loop
Add— user— feedback— (thumbs— up/down,— corrections,— report— buttons)— to— the— product— UI.— Log— feedback— events— linked— to— the— original— request— trace.— Review— feedback— weekly,— cross-reference— with— evaluation— scores,— and— identify— patterns— that— indicate— systematic— issues.
Stage-- 3-- is-- where-- most-- teams-- stall.-- Adding-- a-- thumbs-up-- button-- is-- easy;-- actually-- reviewing-- the-- feedback-- weekly-- and-- turning-- it-- into-- prompt-- or-- retrieval-- improvements-- is-- hard.-- Assign-- a-- named-- owner-- to-- the-- feedback-- review-- cadence-- before-- you-- ship-- the-- button.-- Otherwise-- the-- feedback-- accumulates-- as-- unused-- data-- —-- and-- unused-- data-- is-- just-- storage-- cost.
##— Decision— framework
| — Question— | — Tooling— choice— |
|---|---|
| — Do— you— need— to— debug— a— single— bad— response?— | — Trace— lookup— by— request— ID— |
| — Do— you— need— to— spot— quality— degradation?— | — Evaluation— scores— as— time-series— |
| — Do— you— need— to— prioritise— which— prompts— to— fix?— | — Feedback— frequency— by— prompt— template— |
| — Do— you— need— to— estimate— cost— per— user?— | — Token— usage— by— user— ID— |
| — Do— you— need— to— comply— with— privacy— regulations?— | — Sampled— logging— with— retention— limits— |
##— Related— guides— guides
--- AI— output— monitoring:— what— to— log,— sample,— and— review --- Golden— datasets— for— LLM— products:— how— small— regression— sets— prevent— regressions --- LLM-as-a-judge:— when— automated— grading— helps— and— when— it— lies
##— Conclusion
Observability— is— the— difference— between— knowing— your— LLM— app— is— running— and— knowing— if— it— is— actually— performing— as— intended.— By— implementing— a— structured— approach— to— tracing,— evaluating— prompts,— and— closing— the— feedback— loop,— you— move— from— reactive— monitoring— to— proactive— quality— management.
##— Methodology
--- Data— checked:— 2026-05-28 --- Sources— consulted:— OpenTelemetry— semantic— conventions— for— LLM— instrumentation,— LangSmith— observability— documentation,— Weights— &— Biases— Prompts— documentation,— ICO— guidance— on— AI— and— data— protection --- Assumptions:— This— guide— describes— an— observability— framework,— not— a— specific— tool— recommendation.— Vendor— pricing— and— feature— sets— change— frequently.— The— four-layer— model— (traces,— prompts,— evals,— feedback)— is— a— conceptual— framework;— real— implementations— vary— by— stack— and— traffic— volume. --- Limitations:— This— article— does— not— benchmark— specific— observability— vendors,— does— not— provide— legal— or— compliance— advice,— and— does— not— cover— infrastructure-level— monitoring— (GPU— utilisation,— container— health).— Sampling— rates— and— retention— policies— should— be— determined— by— your— compliance— team. --- Jurisdiction:— Global.— ICO— guidance— referenced— is— UK-specific;— GDPR-equivalent— frameworks— apply— in— the— EU.